
Michał Aleksander’s design studio
Client stories
Commission visual materials or a product website. Build a tool with me when your team regularly returns to the same task.

Visual design
We have a date. We need the materials.
For marketing teams and event organizers. You have a date on the calendar and need a coherent set of materials for print and digital channels.
What you get
- A visual direction and an agreed list of formats
- Digital assets and production files checked against the printer’s requirements
Sample scope
A poster and postcard for one event, with two rounds of feedback.
OP26 / 12 points before press
The conference needed six stickers and a two-sided postcard. A preflight check at A6 found lettering that was too small. I revised the layout and ran the check again.
Once we agree the scope, I send a proposal with the price, review rounds and planned handover. How pricing works

Websites and digital products
Show what your product does.
For founders and product teams. Customers learn about your product in conversation. The site needs to explain its use and give visitors a clear next step.
What you get
- Content structure and a path to a demo or conversation
- Visual direction, mobile and desktop design, and an agreed implementation scope
Sample scope
A single product page with desktop and mobile layouts and two rounds of feedback.
i-Rays / Making an anomaly visible
I compared five opening concepts. The frame with an operator and an anomaly chart became the direction for the site because it illustrated what monitoring does.
Once we agree the scope, I send a proposal with the price, review rounds and planned handover. How pricing works
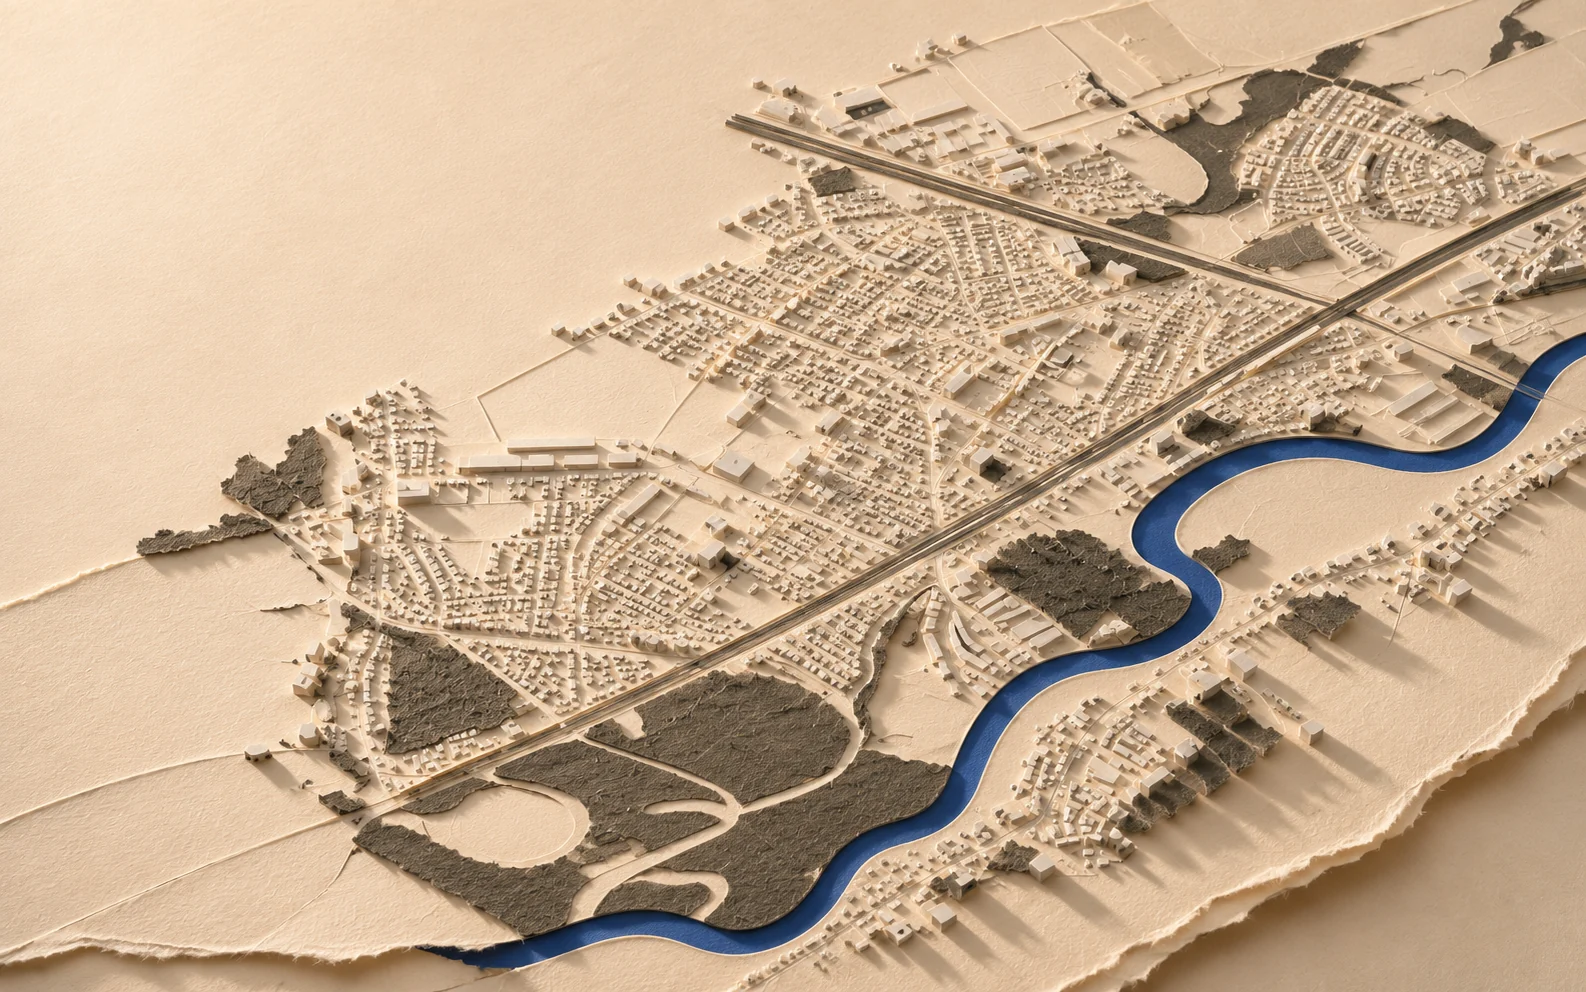
Miasto z bliska / independent project
What is happening in my neighborhood?
Residents start with a place they know. On the interactive 3D map of Luboń, they can see what is happening nearby, check a project’s reported stage and open the source documents.
How I designed the map
- Topic and place. Each map layer shows the relevant locations, with short labels for nearby projects.
- Answers on the map. The preview shows what the project is, the organization or program behind it and the stage it has reached.
- Full details. The project card holds dates, source documents and notes on what the data leaves open.
Design is a stage in its own right
The source for sewer works on Rzeczna Street confirmed the design stage. Its map label showed that stage and flagged construction as unconfirmed. A completed participatory budget project nearby carried a separate status.
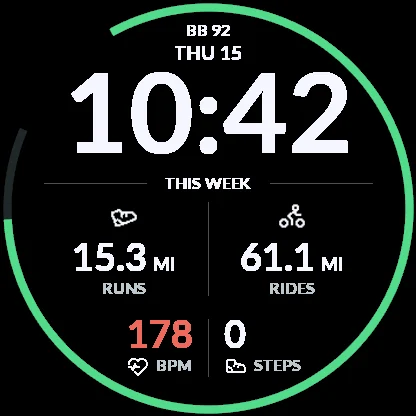
Multi Clean
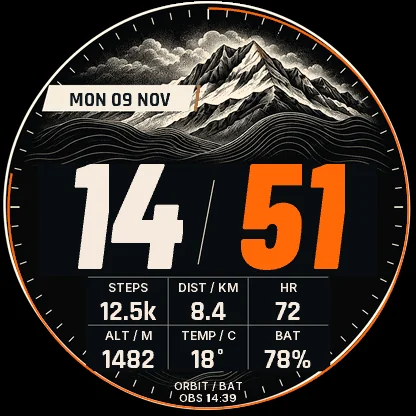
Contour
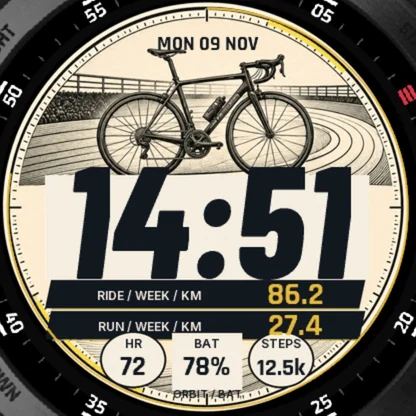
Peloton
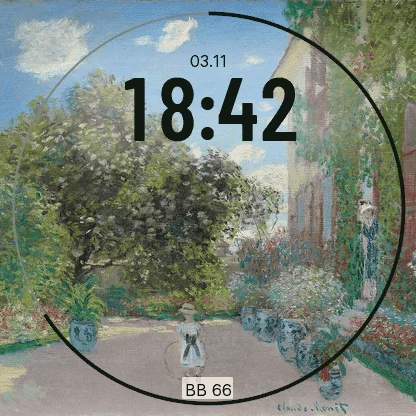
Impression / Monet
ORBIT / independent project
From multisport training to watch face collections.
The first question was how to fit time and data for several sports on a round display. The project grew to include faces people might choose for their character.
How I explored the directions
- Multi Clean. I put weekly running and cycling, heart rate and steps on one face, with the time as its largest element.
- Seven concepts. I compared a dense dashboard, a simpler layout with large numbers and separate views for the day and for training. I also reviewed post-activity and missing-data states.
- Themed collections. Field Studies draws on a mountain engraving, a cycling illustration and a city at night. Impression explores crops of paintings that leave the time legible.
Separate layers for artwork and data
In Field Studies, the artwork forms the background and the watch draws time and metrics separately. That let me design a simpler Always-On view and check it in the simulator.
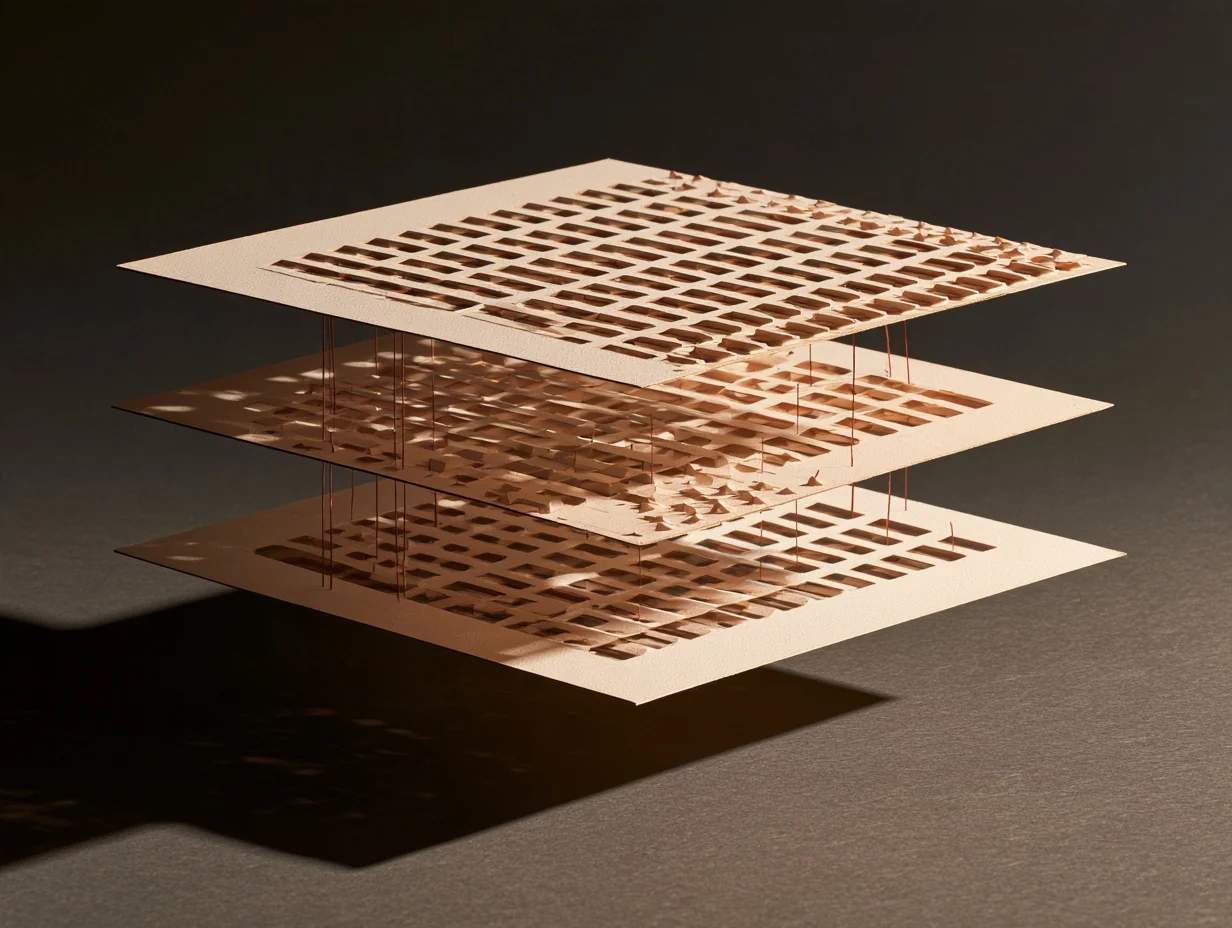
AI tools and workflows
This task comes back every week.
For product and operations leads. Your team gathers context from several places and checks from scratch whether the result is ready to use.
- Input
- One recurring task, a sample of the source material and a way to assess the result.
- Handover
- A map of the task and its owners, a prototype checked against the sample, and a proposed implementation scope.
- Review
- Your team names a reviewer. We assess the result together before deciding whether to implement it.
Sample scope
One task, one sample and an HTML prototype with one round of review.
An anonymized B2B tool audit
The export was enough to read existing material. The audit identified the data and services needed to restore the automation and turned those findings into a migration scope and acceptance criteria.
Once we agree the scope, I send a proposal with the price, review rounds and planned handover. How pricing works
Tell me about your project
Tell me what should change, for whom and by when. Include a sample asset, an existing website or a task your team already does.